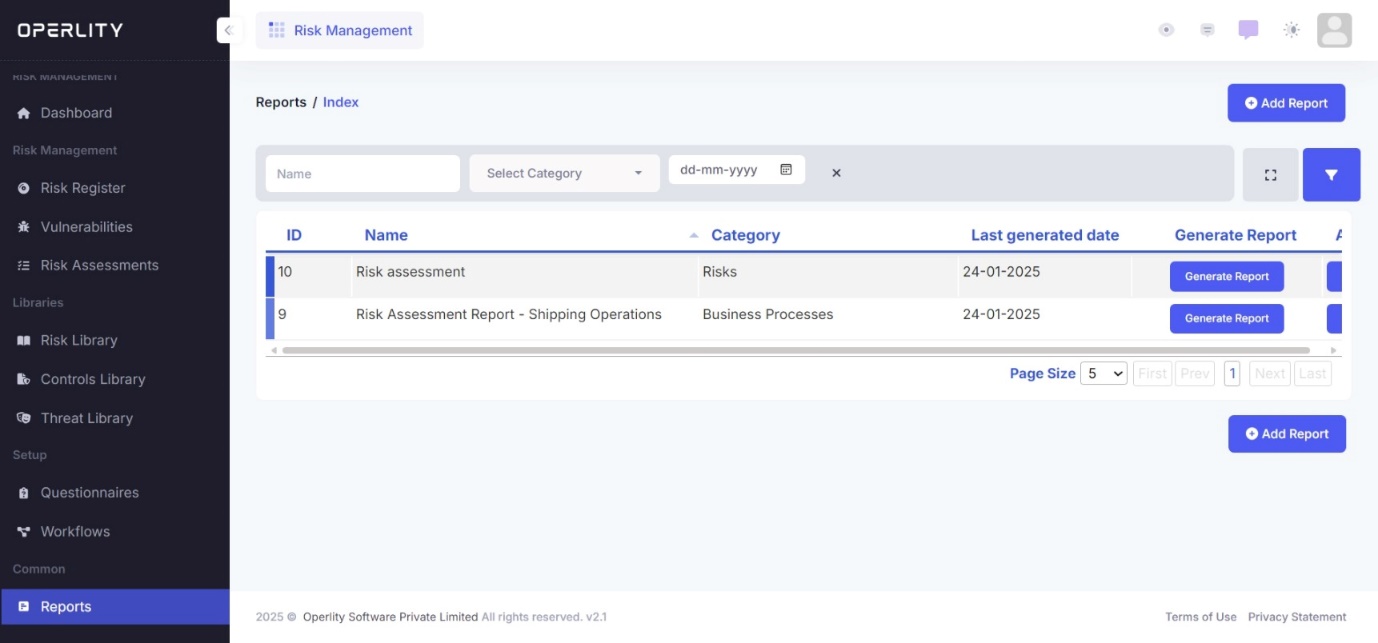
1. Viewing and Filtering Reports
- Navigate to the Reports tab from the left-hand menu.
- The Reports Index displays all previously generated reports.
- Users can filter the reports using the options above the table:
- By Name – Search for a report using its title.
- By Category – Filter reports based on categories such as Risks, Business Processes, Controls, etc.
- By Date – Select a specific date to find reports generated on that day.
Example: If you are looking for a Risk Assessment Report related to Shipping Operations, you can enter the report name or filter it by category under Business Processes.
2. Creating a New Report
- Click on "Add Report" in the top-right corner of the screen.
- Enter a Report Name to define the purpose of the report.
- Example: “Risk Assessment Report – Services”
- Select the Report Object from the dropdown menu.
- Report Objects define what type of data the report will include.
- Available options include:
- Controls
- IT Assets
- Risks
- Business Objectives
- Business Processes
- Location
- Products & Services
- Findings
- Control Implementations
Example: If you need a detailed risk assessment report, select Risks as the report object.
3. Selecting Fields for the Report
- Under the Fields Selection section, choose which data fields to include in the report.
- Available fields are displayed in the left panel, while selected fields appear in the right panel.
- Use the arrow buttons (> and >>) to move fields to the Selected Fields section.
Commonly Used Fields for Risk Reports:
- ID
- Asset Type
- Name
- Location
- Priority
- Owner
- Category
- Created Date
- Last Updated By
Example: If you're generating a Risk Report, you may select fields like Risk Category, Risk Owner, Mitigation Plan, and Priority.
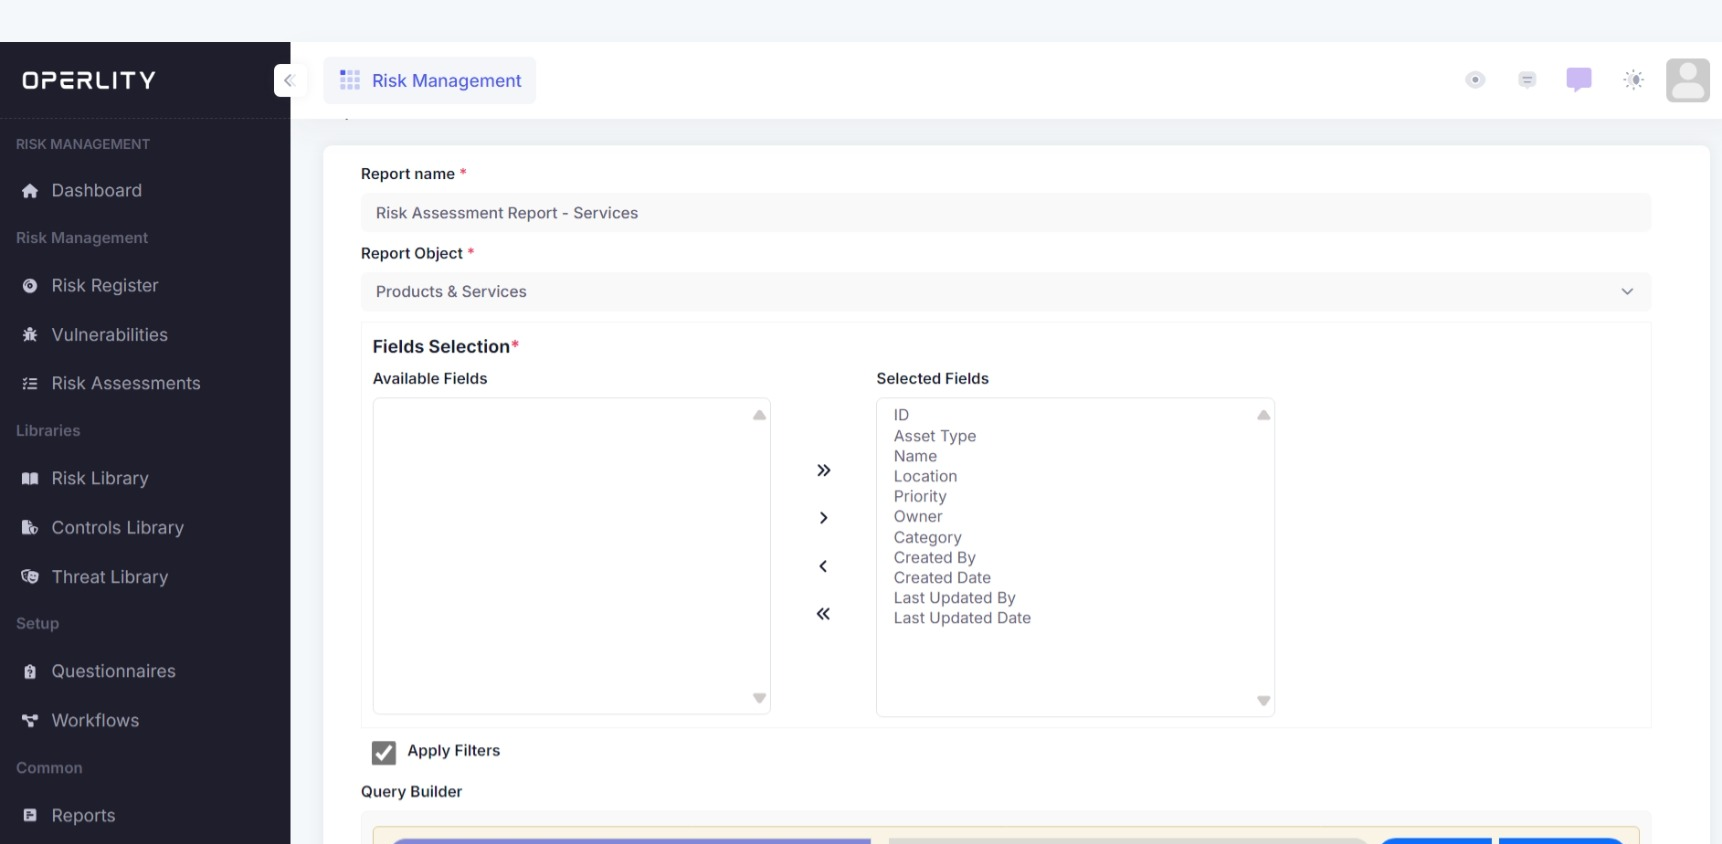
4. Applying Filters and Defining Rules
- Check the "Apply Filters" box to refine the report based on specific conditions.
- The Query Builder allows users to add logical rules to filter data efficiently:
- Use AND/OR conditions to include or exclude data.
- Click "Add Rule" to define a new condition.
- Click "Add Group" to create a more complex filter logic.
Example: If you need a high-priority risk report, you can create a rule:
- Priority = High
- Category = Operational Risks
- Click "Preview Query" to review how the applied filters affect the data.
5. Saving and Generating the Report
- Once the fields and filters are set, click "Save" to finalize the report configuration.
- The report will now appear in the Reports Table on the Reports Index page.
- To download a previously created report:
- Click "Generate Report" next to the report in the table.
- The report will be downloaded to your laptop in the selected format.
- You can now open and analyze the report.
Example: If you created a Business Objectives Report, clicking Generate Report will download a structured document containing all selected data.
Was this article helpful?
That’s Great!
Thank you for your feedback
Sorry! We couldn't be helpful
Thank you for your feedback
Feedback sent
We appreciate your effort and will try to fix the article