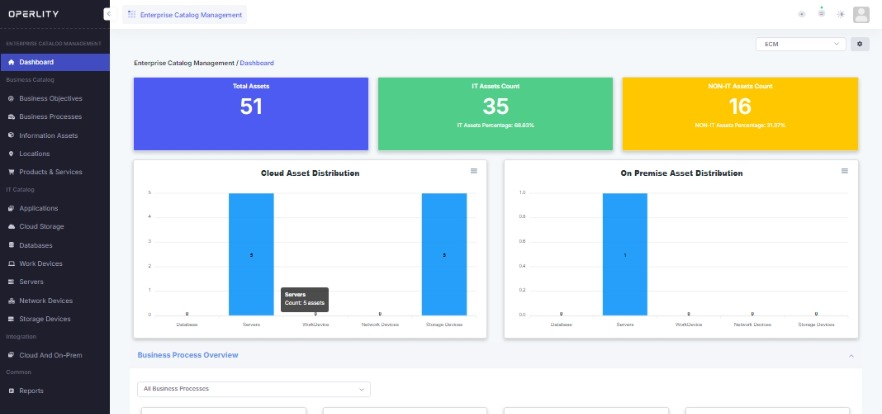
1. Navigating to the Dashboard
- Open GRCHub and navigate to the module whose dashboard you want to customize.
- Each module (e.g., Enterprise Catalog Management, Compliance Management, Risk Management) has its own default dashboard.
- The dashboard displays key metrics, asset distributions, and other graphical insights.
2. Accessing Dashboard Customization
- Look for the Settings icon (⚙️) at the top-right corner of the dashboard.
- Click on the Settings icon to open the dashboard customization panel.
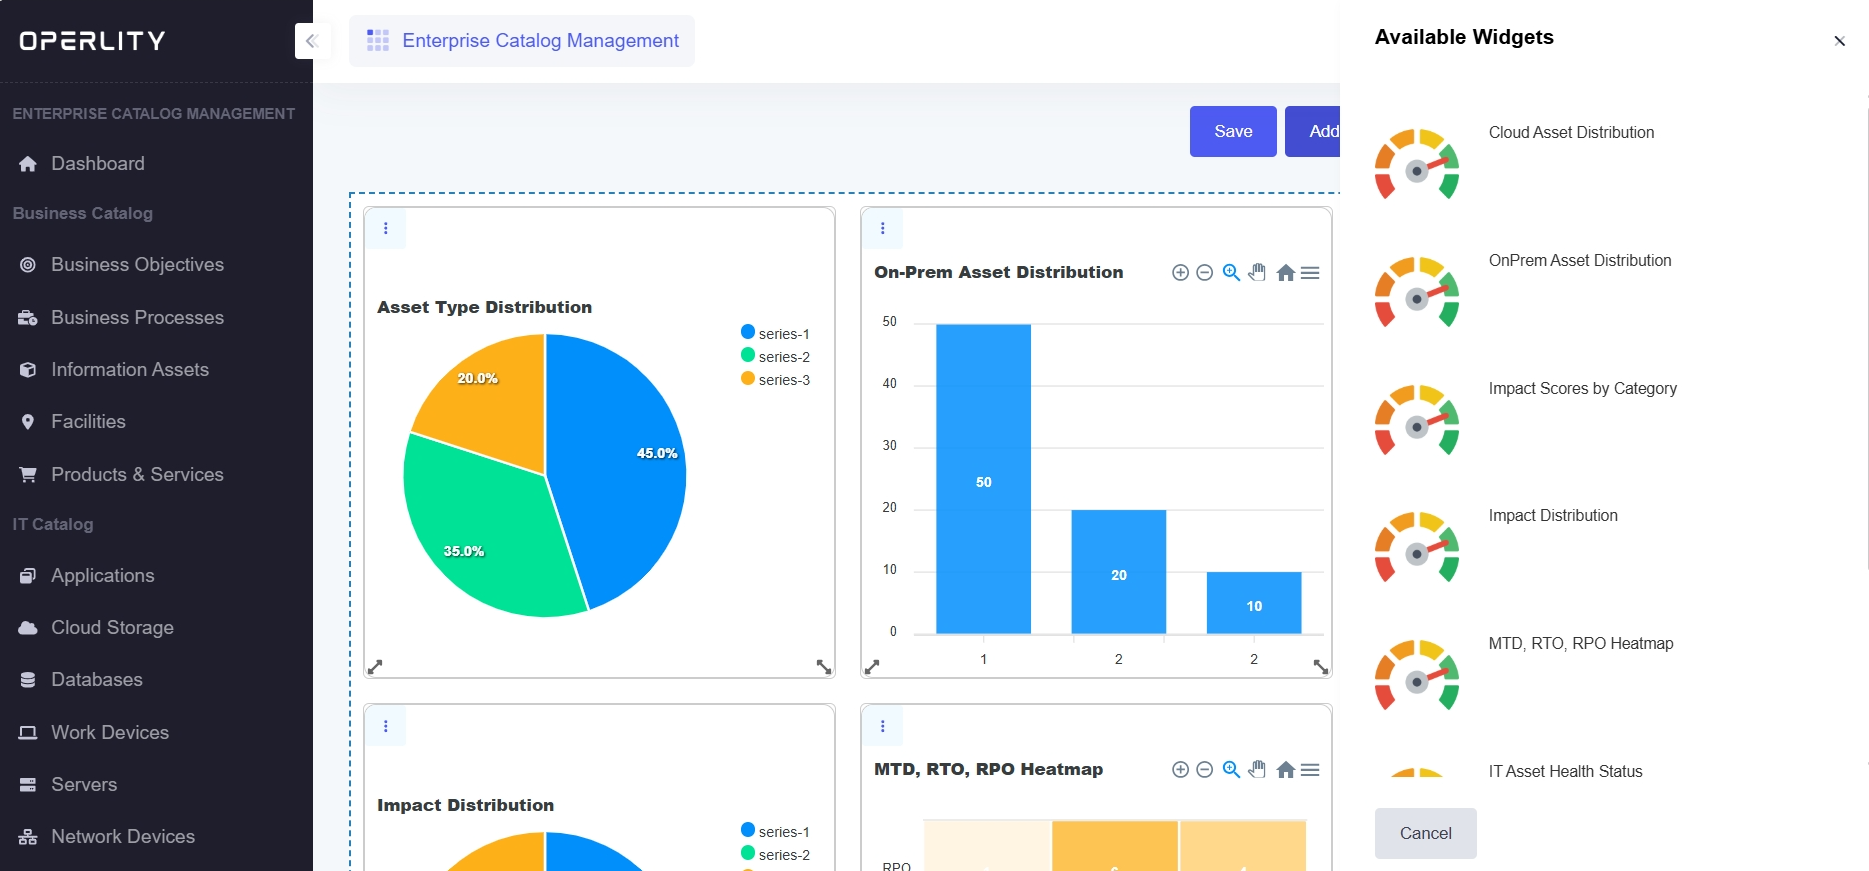
3. Adding Widgets
- Click on "Widgets" to view the list of available dashboard widgets.
- Select the widgets relevant to your dashboard, such as:
- Total Asset Count
- IT vs. Non-IT Asset Distribution
- Cloud vs. On-Premises Asset Distribution
- Compliance Heatmaps
- Business Impact Scores
- Once selected, the widgets will appear on your dashboard.
Example: If you are in Enterprise Catalog Management, you may add widgets like Asset Type Distribution or Impact Scores by Category.
4. Arranging and Resizing Widgets
- Click and drag the widgets to rearrange them.
- Resize widgets to adjust their height and width for better visibility.
- Organize the layout in a way that best suits your reporting and monitoring needs.
Example: You can place critical metrics like Total Asset Count at the top, while less frequently accessed widgets can be positioned below.
5. Saving the Customized Dashboard
- After making adjustments, click "Save" to apply changes.
- The updated dashboard will now reflect your preferred layout and widget selections.
Was this article helpful?
That’s Great!
Thank you for your feedback
Sorry! We couldn't be helpful
Thank you for your feedback
Feedback sent
We appreciate your effort and will try to fix the article